
Explore Gadda's literary world by browsing through his bookshelves.
Delving into Gadda's personal library offers a unique insight into the preferences and habits that shaped him as an author. The data extracted from his library allows us to explore the mind of the engineer through a careful analysis. This page presents the data with the goal of providing a straightforward visualization of key aspects:
- Authors. Representation of the writers present in Gadda's library.
- Books. Information about the volumes, including genre and edition year, to offer a comprehensive view of Gadda's literary collection.
- Annotations.Focusing exclusively on the text annotated by Gadda, shedding light on his thoughts and interactions with the content.
His library reflects a rich tapestry of intellectual interests. With a core in Italian literature, it extends globally to encompass history, philosophy, technology, and languages. Beyond traditional genres, the collection spans arts, geography, and military topics, showcasing a multifaceted exploration of human expression and the world.
The data is organized and presented hierarchically in a radial bar chart. The primary layer represents the genre, while the secondary layer delineates subgenres, ensuring a comprehensive insight.
Click on each genre to gain a focused perspective.
Hover inside the chart to visulize the number of books for each year and use the scrollbar to zoom in.
The data underscores the author's engagement with scholastic volumes. This emphasis on annotated study materials suggests a dedicated scholarly pursuit, where the act of annotating serves as a means of active learning and critical exploration.
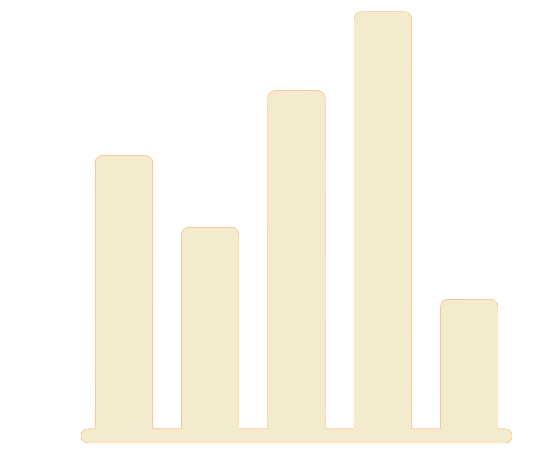
Hover on each column to find how many annotation each book contains.
Hover on each column to find how many times each author has been annotated
The word cloud visually presents the most frequently used words in Gadda's annotations, extracted from Excel spreadsheets of word frequencies. This graphical representation offers an immediate and intuitive glimpse into the recurring themes, concepts, and emphases that characterize Gadda's annotations
Hover on the chart to see the number of occurances